What the Reports section is
The Reports page (/reports in the sidebar) is your read-only view of business activity in reservie. Each report is purpose-built for a specific question — who’s been booking?, what did we earn?, who’s attended their classes? — and you can export the underlying data when you need it in a spreadsheet or for your accountant.
Reports are grouped into seven tabs across the top of the page:
| Tab | What’s in it |
|---|---|
| Booking Reports | Customer bookings, drop-offs, and detail |
| Pass Reports | Pass purchases and usage |
| Attendance Reports | Who turned up — by event, by customer, and waiting list activity |
| Financial Reports | Revenue, refunds, and per-event finances |
| Questionnaire Reports | Aggregate responses to forms (when in use) |
| Facilitator Reports | Activity by instructor/facilitator |
| Appointment Reports | Reports specific to one-to-one appointments |
Empty tabs mean there are no reports of that type configured for your account yet — more are added over time.
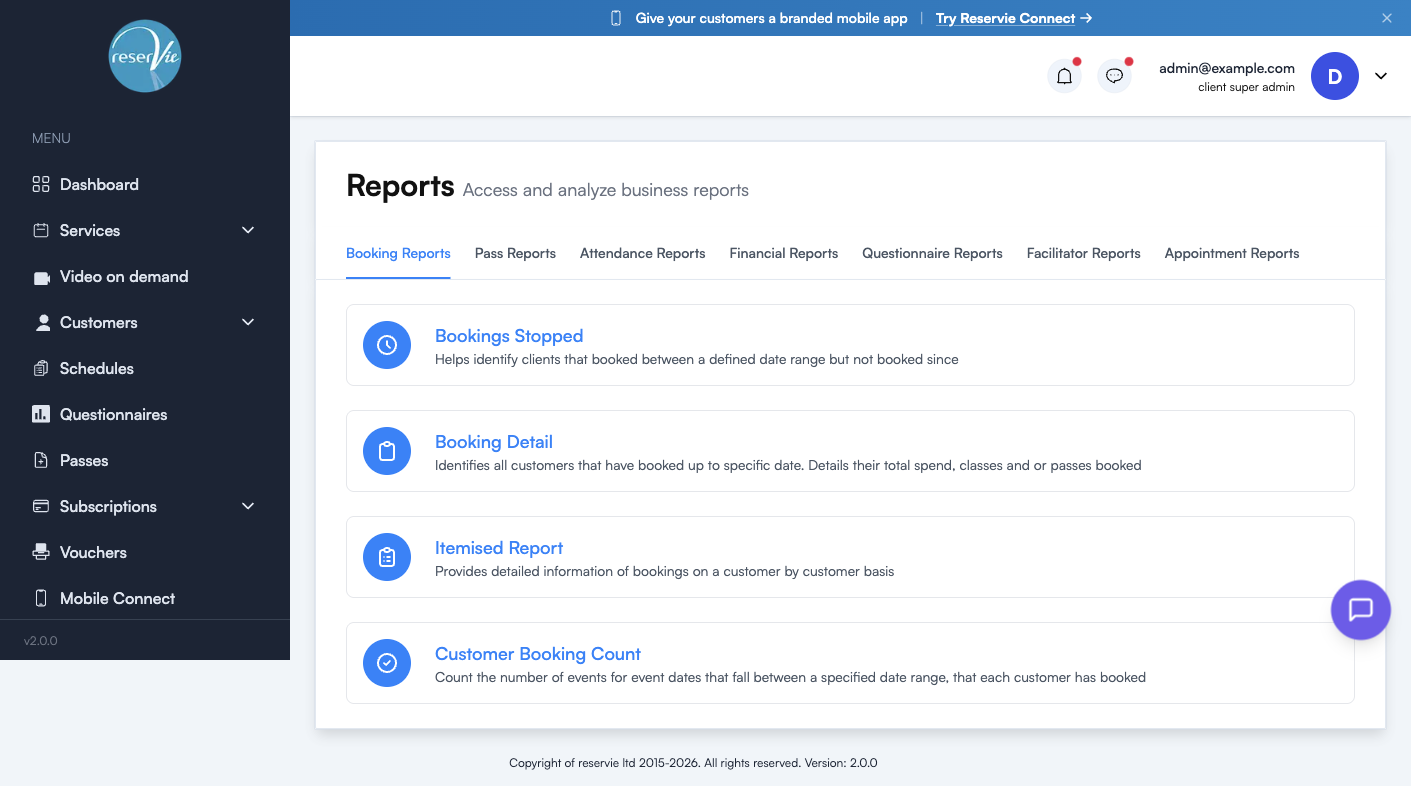
Booking Reports
| Report | Use it to answer |
|---|---|
| Bookings Stopped | ”Who used to book and has gone quiet?” — Identifies clients who booked between a defined date range but haven’t booked since. Great for re-engagement campaigns. |
| Booking Detail | ”What’s our customer health snapshot?” — All customers who’ve booked up to a specific date, with their total spend, classes attended, and passes held. |
| Itemised Report | ”Show me everything for this customer.” — Detailed customer-by-customer booking history. |
| Customer Booking Count | ”How many classes did each customer book in this window?” — Counts events booked by each customer in a date range. |
Tips for booking reports
- Bookings Stopped is most useful with a clear “engaged” window — e.g. “booked in the last 90 days but not the last 30” — to surface customers slipping away early.
- Customer Booking Count plus a price assumption is a fast way to answer “who are my top 10 customers by activity?” without exporting Stripe data.
Pass Reports
| Report | Use it to answer |
|---|---|
| Pass Purchase Overview | ”Which passes are people buying?” — Aggregate view of pass purchases over time, useful for understanding which passes are pulling weight commercially. |
Attendance Reports
| Report | Use it to answer |
|---|---|
| Event Attendance Overview | ”What’s been happening at our classes?” — Cross-event view of attendance figures. |
| A Count of Classes Attended | ”How many classes has each customer attended?” — Per-customer attendance counts. Pair with bookings for a no-show ratio. |
| Subscribed to Waiting List | ”Who’s been on the waiting list?” — Identifies waiting list activity, which can highlight under-capacity classes. |
Tips for attendance reports
Attendance numbers depend on the Attended toggle being flipped on each booking — see Managing Event Registrations. If you don’t routinely mark attendance, these reports will under-count.
Financial Reports
| Report | Use it to answer |
|---|---|
| Financial Detail Per Event | ”How much did this event make us?” — Revenue, refunds, and net for each event date. |
| Percentile Distribution of Sales by Class (coming soon) | “Where do most of our sales come from?” — Highlights long-tail vs. concentration. |
| Monthly Charge Aggregation Report (coming soon) | “What’s the monthly total across all charges?” — Roll-up by month for accounting. |
| Percent Distribution of Sales by Category (coming soon) | “How is revenue split across categories?” — Useful for understanding format mix. |
For accounting: for tax filings and book-keeping, pair Financial Detail Per Event with the underlying Stripe payment record. Stripe is the source of truth for what hit your bank account; reservie’s report tells you which booking each charge corresponds to.
Questionnaire / Facilitator / Appointment reports
These tabs will populate as you adopt those features:
- Questionnaire Reports appear once customers have started submitting questionnaire responses
- Facilitator Reports become useful once you have multiple facilitators and want to compare their activity
- Appointment Reports track one-to-one bookings, refunds, and gaps in availability
Until then, these tabs are intentionally empty — we’d rather show nothing than a dashboard pretending to summarise data you haven’t generated yet.
Running a report
Click any report card on the Reports page. Most reports follow the same pattern:
- Choose a date range (or other filter — e.g. specific event, specific facilitator)
- Click Run to generate the report
- Review on screen, then Export to CSV if you need to take it elsewhere
Each report’s filters are tailored to the question it answers — e.g. Bookings Stopped asks for “booked between X and Y, but not since Z”.
Common scenarios
”I need a sales summary for last month for my accountant.”
Financial Reports → Financial Detail Per Event, set the date range to last month, export to CSV. Cross-check with Stripe’s monthly summary.
”Which customers haven’t booked in a while?”
Booking Reports → Bookings Stopped, set “booked between” to last 6 months, “not booked since” to last 30 days. Export and use as the seed list for a re-engagement email.
”Who attended the most classes this term?”
Attendance Reports → A Count of Classes Attended, set the date range to the term, sort the result by count.
”Are my passes selling?”
Pass Reports → Pass Purchase Overview, look at the trend line by month. If a pass has tanked, consider whether the price has drifted out of line with the cost-per-class equivalent.
Where to go next
- For finance — see Accepting Payments Online for the Stripe-side view
- For attendance — see Managing Event Registrations for marking customers as attended
- For passes — see Getting Started with Passes